

Conditional Formatting Examples: Datasets
Datasets applies complex selection logic to reflect the multi-dimensionality of a query. Using the various settings, users can deploy more intelligent conditional formatting than just simple "flat" calculations. More importantly, the dataset models will provide a smarter way to highlight data when users slice, dice and drill into their data.
| Type | Example |
|---|---|
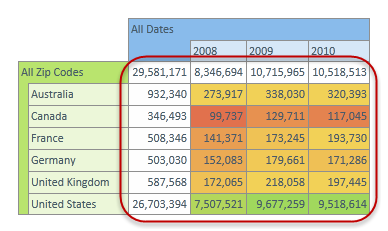
| Lowest: the CF selection only applies to the "lowest" level in the query - which is the countries on the rows and the years on the columns. The other cells are higher levels. |
|
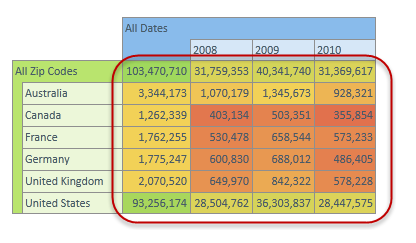
| Flat: the CF selection applies across all cells in the grid regardless of level and hierarchy. In this case Australia,2008 is compared to All zip Codes for All time and colored accordingly. |
|
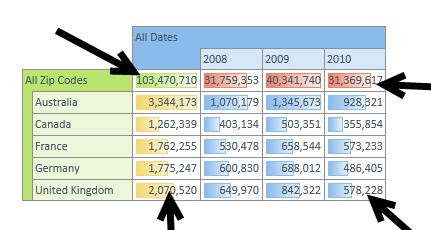
| Hierarchical: the CF selection, applied across the grid, is applied 4 times reflecting the 4 combinations of hierarchical data visible. Blue - lowest of dates and region; Yellow - all dates and lowest of region; Red - all regions and lowest of dates; Green: all regions and all dates. |
|
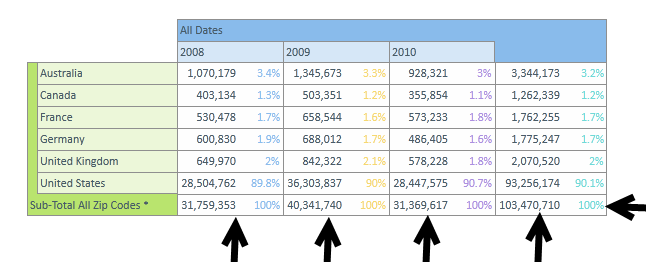
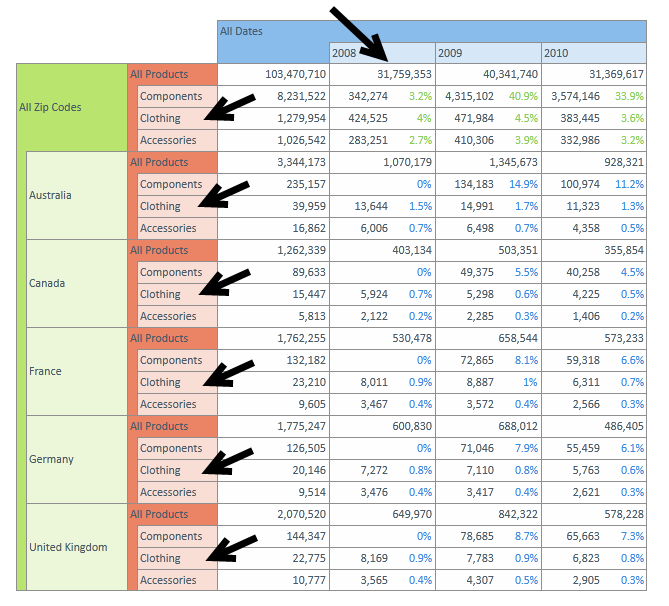
| Hierarchical 2: the CF selection, applying to the column ZONE, is applied down each column hierarchically. As such, each of the countries totals to 100%. the All Zip code total at the bottom is only compared to itself for each column and therefore reflects 100% on its own. |
|
|
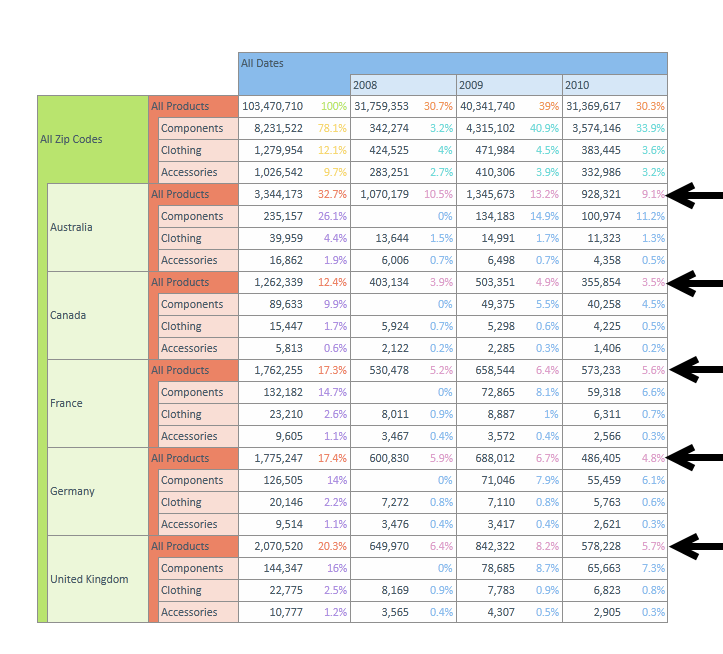
Hierarchical 3: In this third example, the sophistication of the hierarchical datasets demonstrates its ability to compare levels across multiple dimensions and multiple levels. In this case applying to an entire grid, each of the colored percentages are only mathematically compared to their "hierarchical counterparts" on the grid. For example the all products subtotals by the countries level of region are comparable to each other - but are not comparable to the total for all regions etc. |
|
| Inner Hierarchy: the CF selection only applies to the lowest level of the "inner" dimensions: dates on the columns and products on the rows. Hence there are 2 selection spaces: the product level for all regions and the product level for each of the countries in the region. The color reflects the separate selections and logic. |
|
Home |
Table of Contents |
Index |
User Community
Pyramid Analytics © 2011-2022